.png?width=250&height=153&name=CSI-OverskiesRebrand_LOGO-01(smaller).png "Overskies Logo")

.png?width=100&height=61&name=CSI-OverskiesRebrand_LOGO-01(smaller).png "CSI-OverskiesRebrand_LOGO-01(smaller)")


Introduction
User experience (UX) is the key to connecting with audiences. The right UX analytics tools reveal insights that boost user satisfaction and conversion rates. Let’s look at ten essential tools that help brands analyze user behavior and optimize their digital strategies. Brands often struggle to turn insights into action. How can they make the most of their analytics?
Overskies: Creative Advertising Solutions for Enhanced UX Analytics
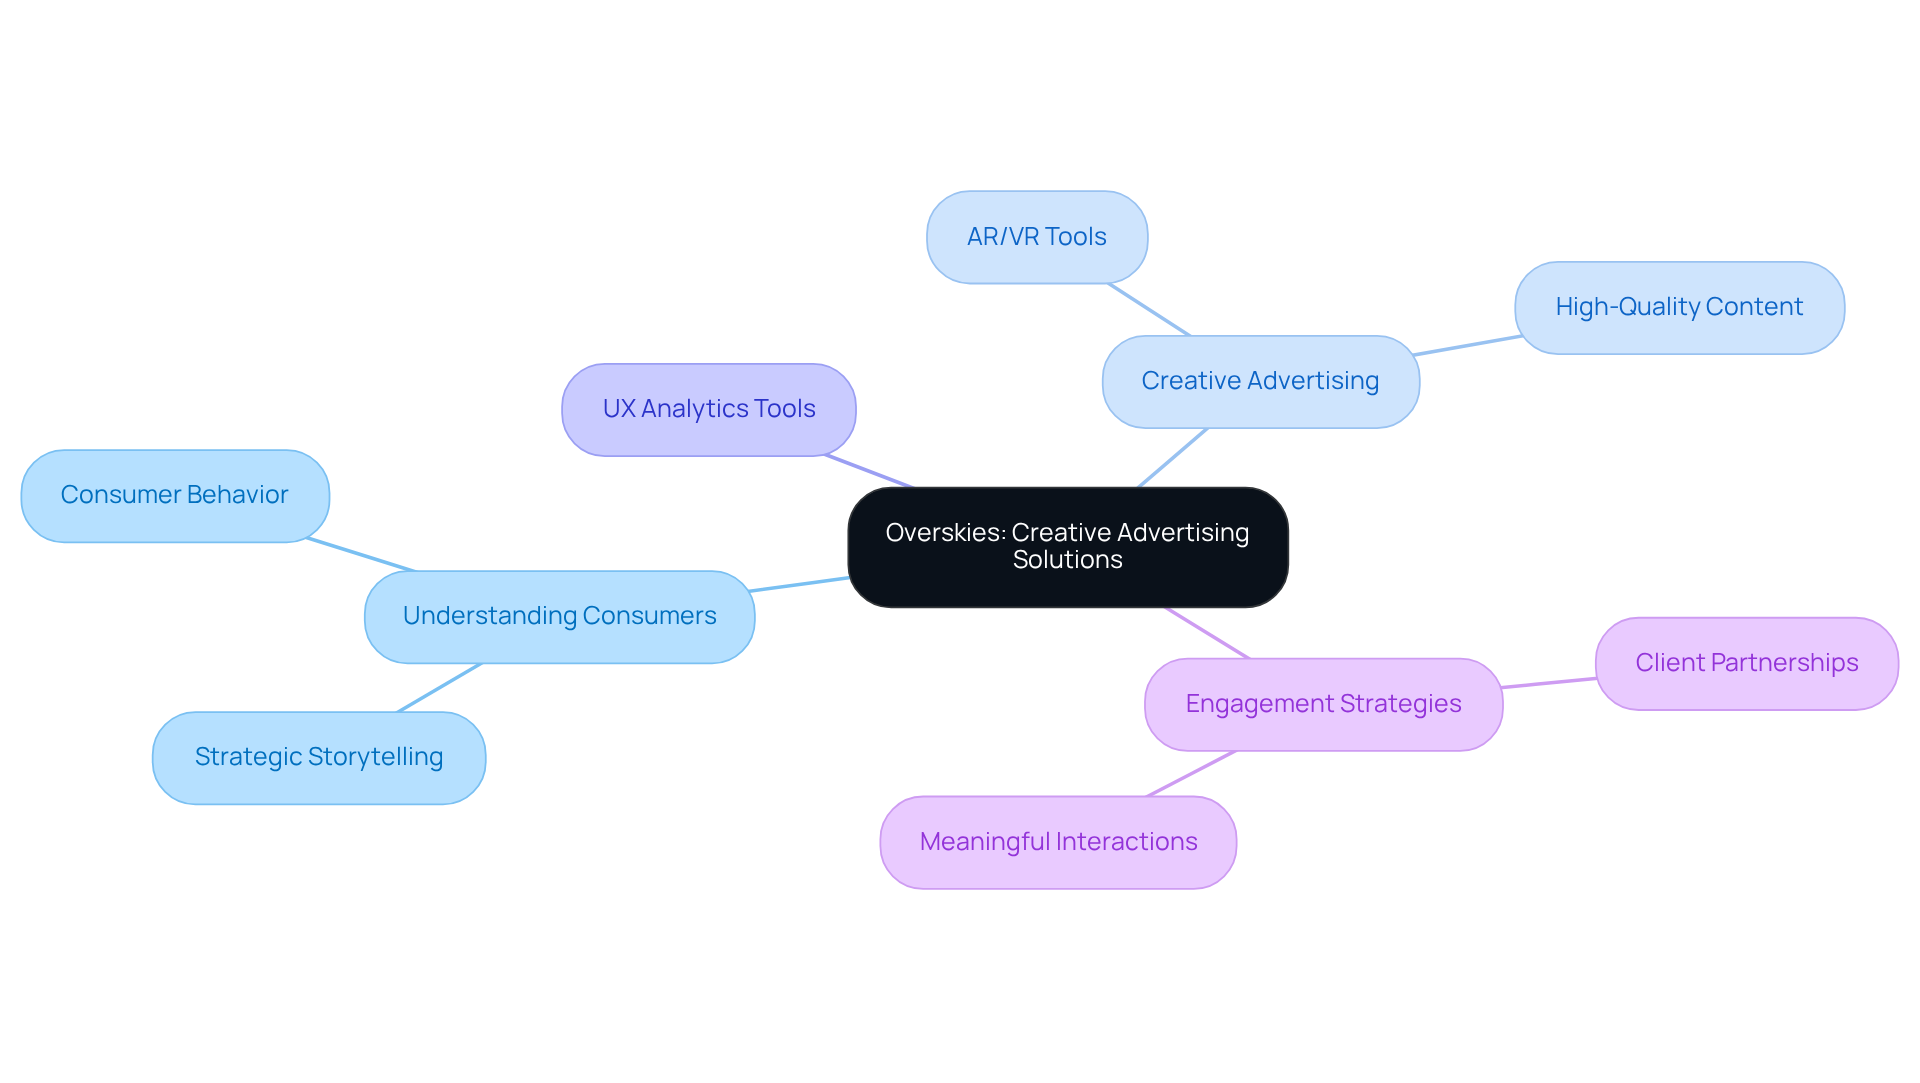
Overskies transforms how brands understand their consumers through strategic storytelling and the use of ux analytics tools. Yet, many brands struggle to truly grasp what their consumers want. By integrating creative advertising solutions, Overskies helps businesses understand consumer behavior better. This optimization boosts their digital presence.
Immersive interactions like AR and VR are essential for engaging audiences. With 14% of marketers using these tools, Overskies is leading the charge, helping clients craft narratives that resonate. As 96% of prospects research before engaging with sales, the agency's focus on high-quality content and strategic marketing becomes critical.
Overskies drives better engagement and customer satisfaction by utilizing advanced ux analytics tools. I've seen them help brands exceed client expectations. This commitment to excellence is evident in their partnerships with clients like Citizen and Bulova, who value the collaborative and nimble approach Overskies brings to every project. As digital marketing evolves, brands that prioritize meaningful interactions will stand out in a crowded marketplace.
Google Analytics: Comprehensive Insights into User Behavior
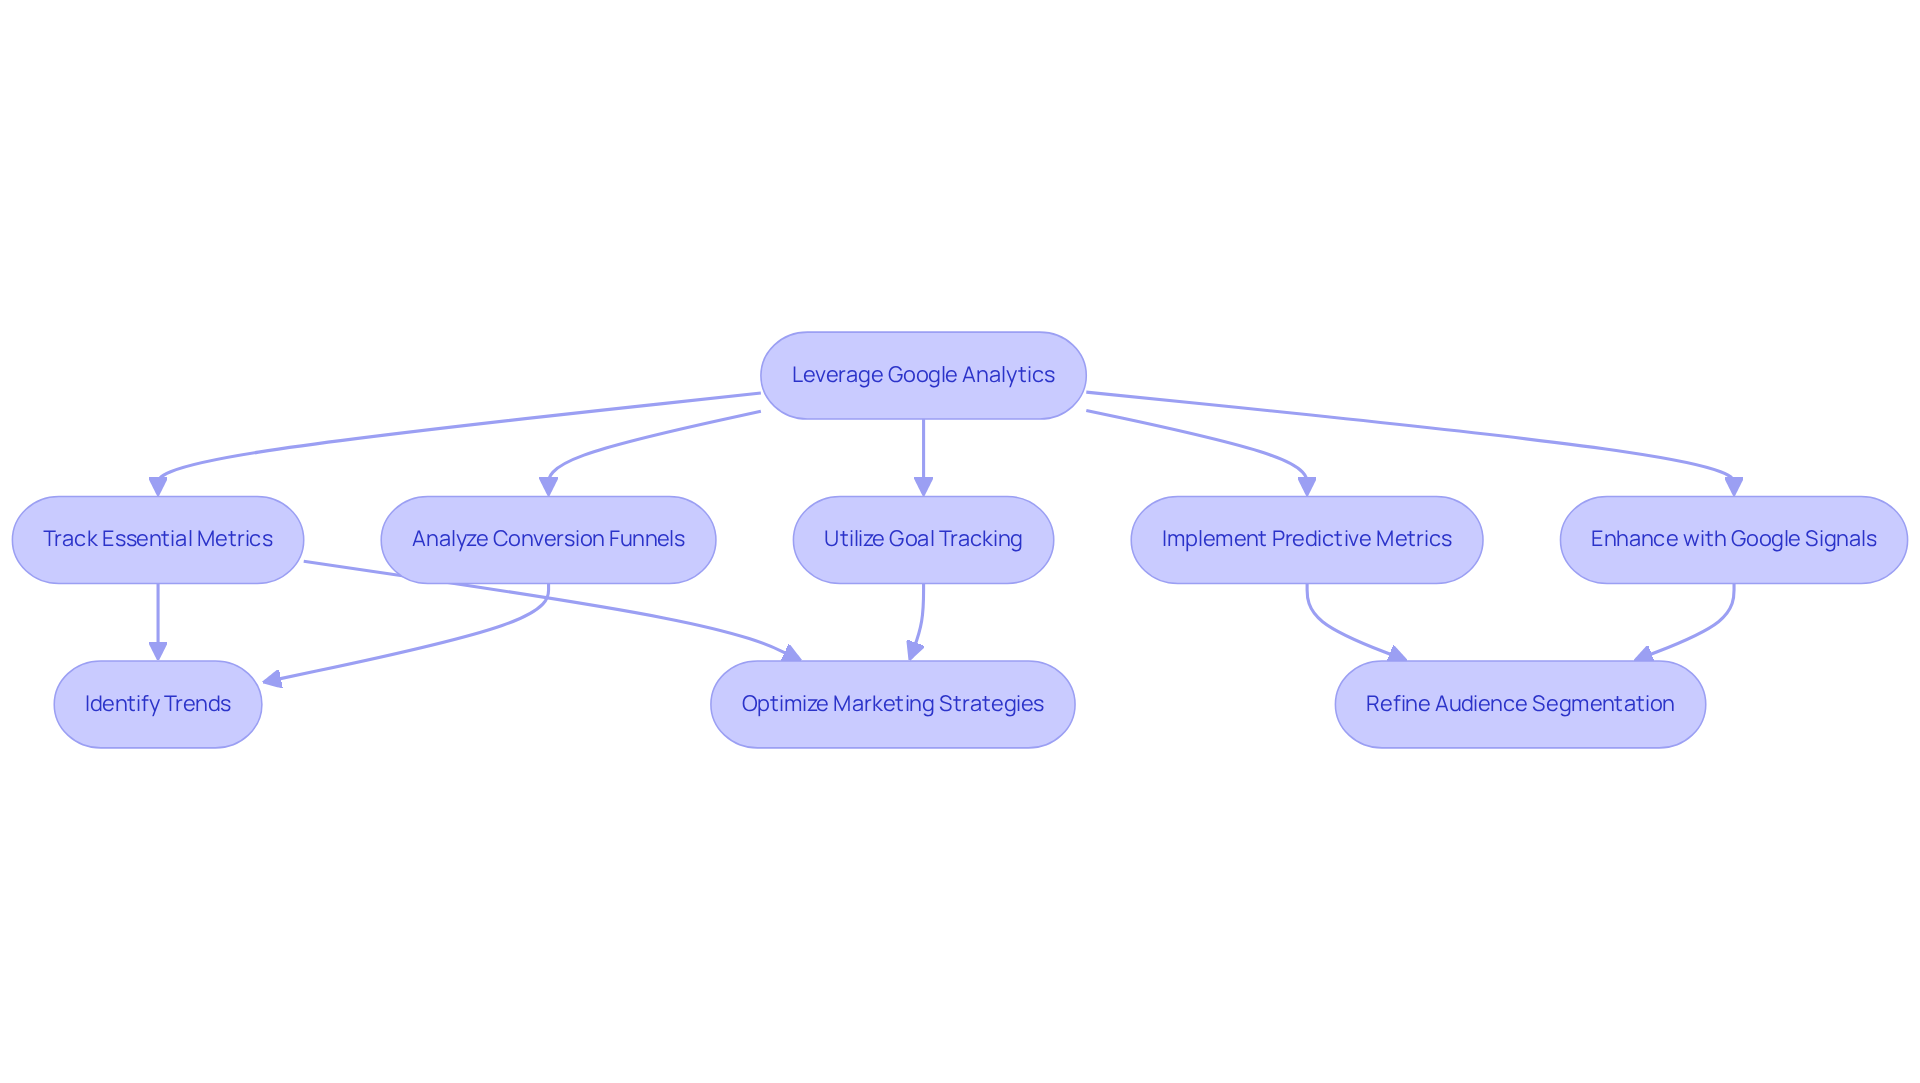
Many businesses struggle to fully leverage Google Analytics, despite its potential to transform their understanding of user behavior. It meticulously tracks essential metrics like page views, session duration, and demographics, but many teams overlook key features like goal tracking and conversion funnels that can really show how UX improvements are performing. In 2026, the platform's event-based data model captures every action as a distinct event, providing granular insights into interactions. This capability is essential for identifying trends and optimizing marketing strategies, ultimately enhancing the overall experience for users.
With the introduction of predictive metrics, businesses can anticipate user behavior, such as purchase likelihood and churn risk. This means that without a clear strategy, brands risk missing out on valuable insights that could drive their success. Google Signals enhances reports with cross-device behavior and demographic information, further refining audience segmentation.
We use AI to sharpen our insights, helping us optimize campaigns and boost return on ad spend (ROAS). Our approach to hyper-personalized customer experiences - tailored to individual preferences - significantly boosts conversion rates. Case studies from retail brands illustrate the impact of Google Analytics. For instance, brands utilizing its capabilities have successfully mapped client journeys, pinpointing engagement hotspots and drop-off points, which directly informs content strategy and marketing efforts. By leveraging these understandings, Overskies can improve customer experience and drive higher conversion rates.
Hotjar: Visualizing User Interactions with Heatmaps and Recordings
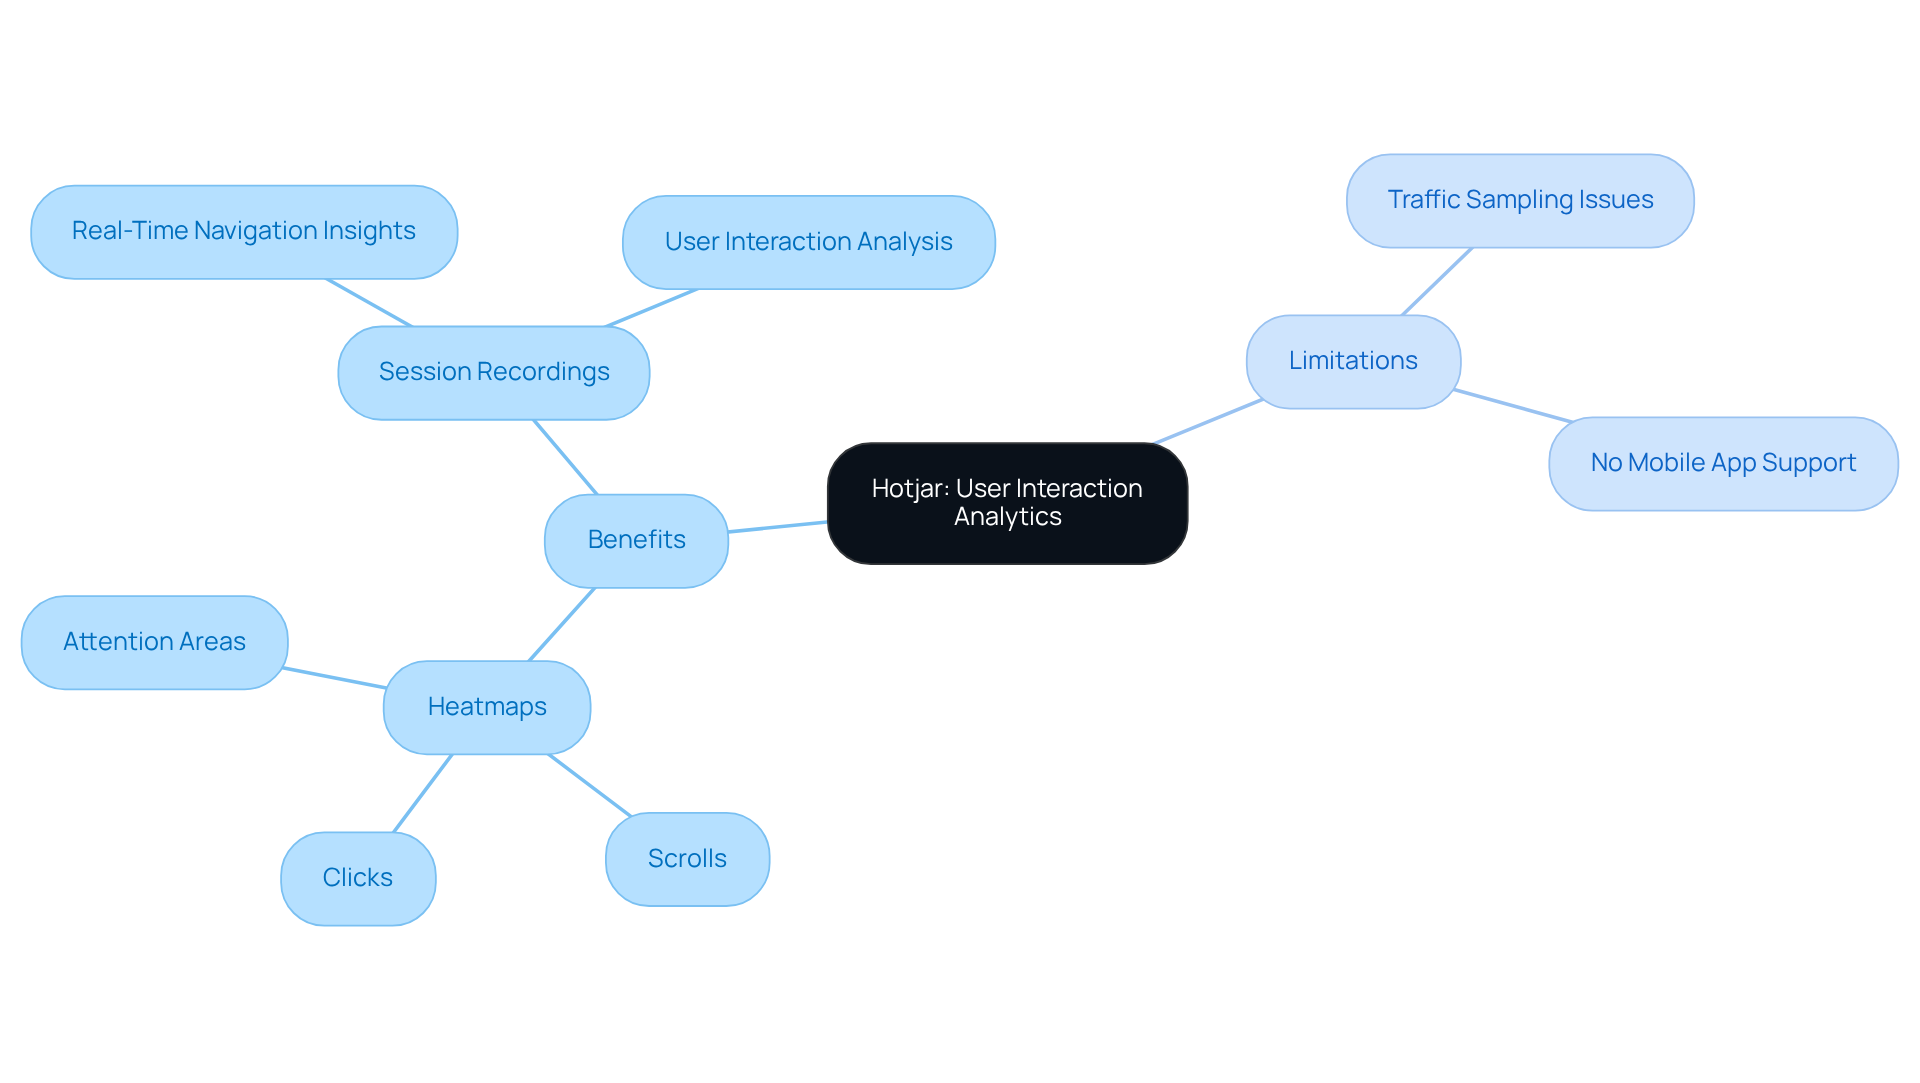
Hotjar reveals the hidden patterns in user behavior that many brands overlook. With over 433,000 active domains, it’s clear that brands are starting to see the value in understanding user behavior through Hotjar. Heatmaps show where users click, scroll, and linger, helping teams pinpoint what grabs attention and what gets ignored. Session recordings offer a real-time look at how users navigate sites, providing insights that can drive data-driven decisions.
But let’s be real - Hotjar has its limits, like traffic sampling issues and no mobile app support, which can complicate things for businesses. Since Hotjar combined with Contentsquare in July 2025, this integration may also shift how brands approach user experience analytics. Understanding these limitations can redefine how brands utilize UX analytics tools for user experience.
Mixpanel: Event-Based Tracking for User Engagement Insights
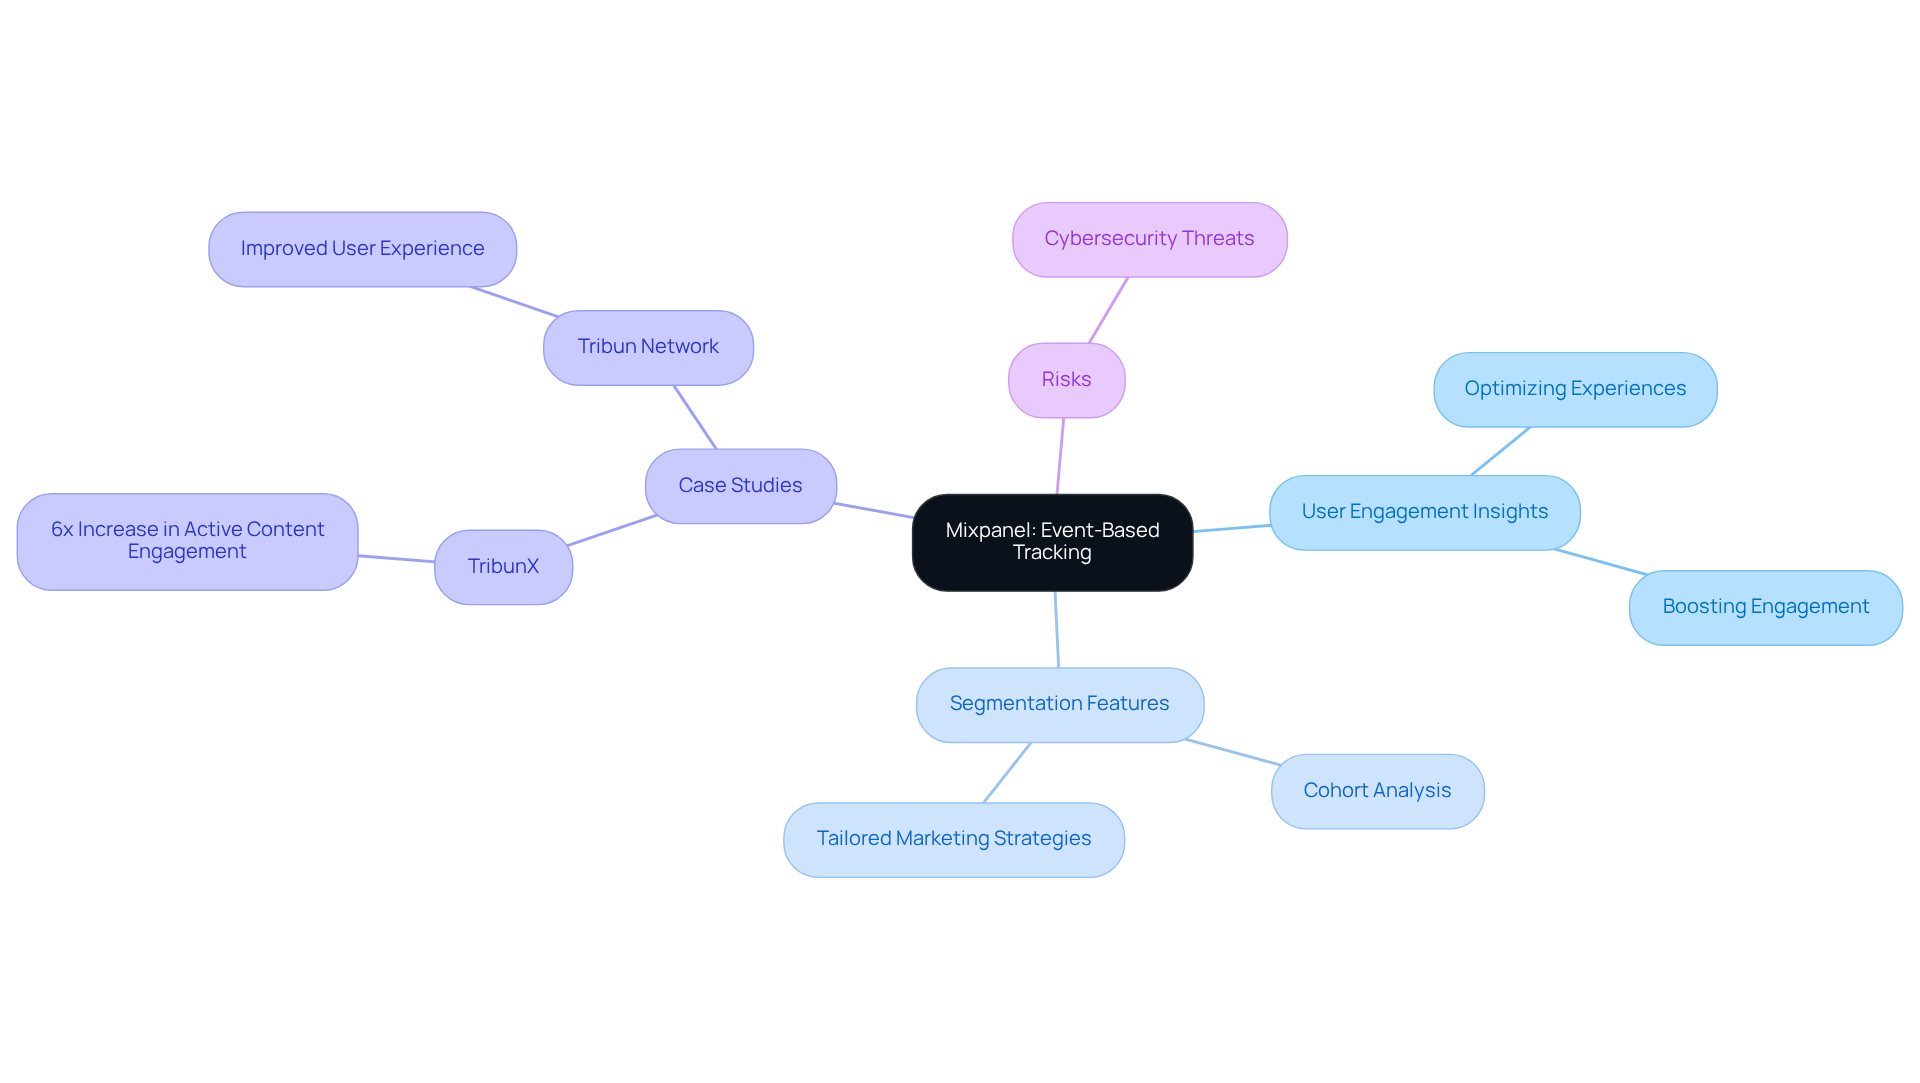
Mixpanel stands out in analytics with its event-based tracking, offering businesses deep insights into user engagement. Tracking user actions within apps or websites reveals valuable insights. This level of detail helps teams optimize experiences and boost engagement.
The platform's segmentation features allow businesses to analyze cohorts effectively, tailoring marketing strategies to meet the unique needs of different segments. Companies using Mixpanel often see notable boosts in engagement metrics. For DTC brands, utilizing Mixpanel's event-based tracking can lead to significant improvements in engagement. Some have reported a 6x increase in active content interaction on TribunX, where the share of individuals actively viewing content rose from 5% to 30%.
Mixpanel's capabilities are especially advantageous for retail and e-commerce sectors, where understanding consumer behavior can directly impact conversion rates. For example, Tribun Network employed Mixpanel to visualize interactions through its Session Replay feature, resulting in an improved experience and a significant rise in active participants. This case illustrates how event-based tracking can deliver actionable information that drives business growth and enhances customer satisfaction.
DTC brands face stiff competition, making effective engagement strategies essential. Adopting Mixpanel's event-based tracking offers the tools necessary to refine these strategies and ultimately boost brand performance. However, ignoring the potential risks, like cybersecurity threats, could undermine the very growth these tools aim to achieve.
Amplitude: Optimizing User Journeys with Advanced Product Analytics
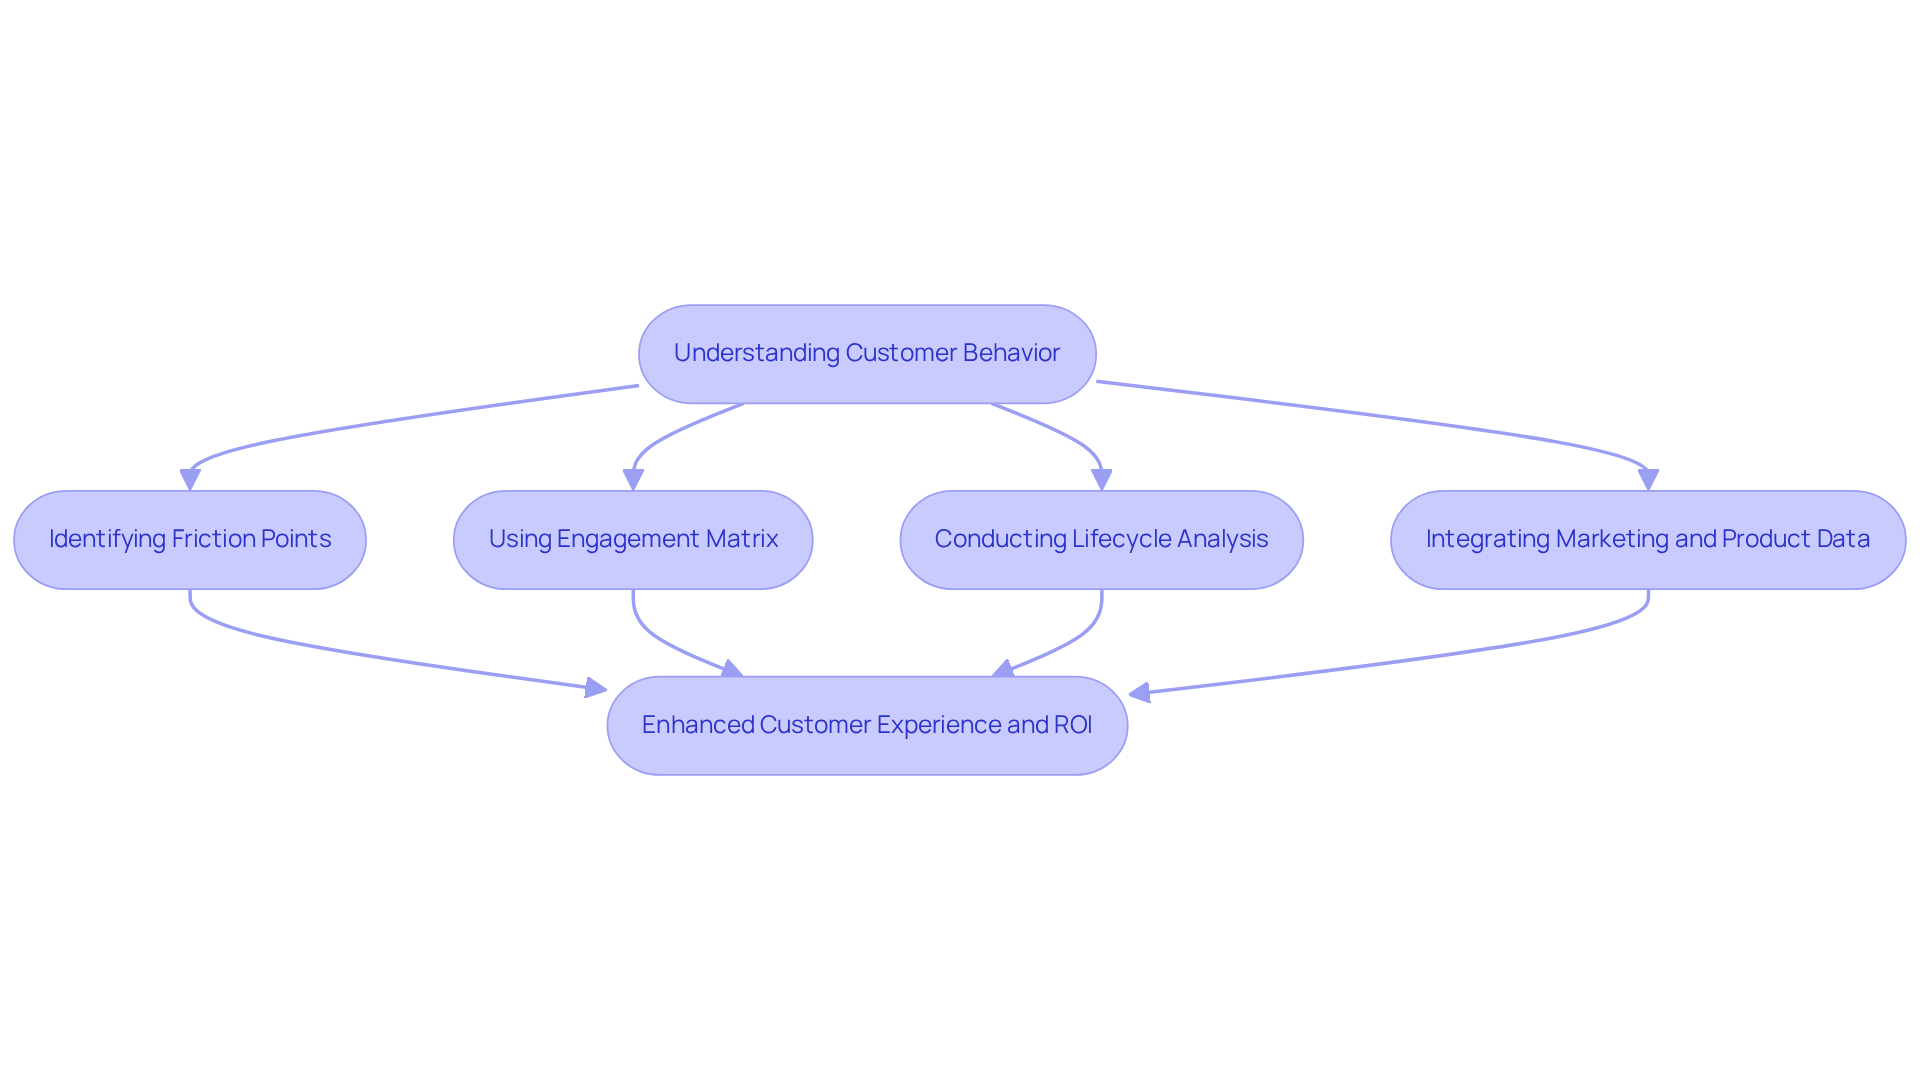
Amplitude isn’t just another analytics tool; it’s a game-changer for brands looking to truly understand their customers. I’ve seen brands struggle to grasp customer behavior, but Amplitude changes that by offering deep insights into interactions. By analyzing flows and pinpointing friction points, Amplitude empowers teams to make data-driven decisions that enhance the experience.
But identifying those friction points isn’t always straightforward; it requires a deep understanding of customer behavior. In 2026, brands using Amplitude will find their journey optimization efforts recognized, especially in e-commerce. For instance, brands leveraging Amplitude have reported significant boosts in engagement and conversion rates.
The platform’s advanced features, like the Engagement Matrix and Lifecycle analysis, help categorize individuals and identify re-engagement opportunities, ensuring brands can effectively meet the needs of both new and returning clients. I’ve seen case studies where luxury brands transformed their customer journeys using Amplitude’s AI-driven insights.
By integrating marketing and product data, Amplitude enables brands to refine their strategies, ultimately leading to higher returns on investment and enhanced customer experiences. What many brands overlook is that without a clear strategy, even the best tools can fall short of delivering real results.
Contentsquare: In-Depth Analysis of User Engagement Metrics
Many brands find it challenging to decipher how users truly interact with their content through ux analytics tools. By meticulously capturing data on interactions like clicks, scrolls, and time spent on pages, Contentsquare provides ux analytics tools that enable businesses to gain a nuanced understanding of engagement metrics. This capability is crucial for brands looking to enhance their digital interactions and drive higher conversion rates through the use of ux analytics tools.
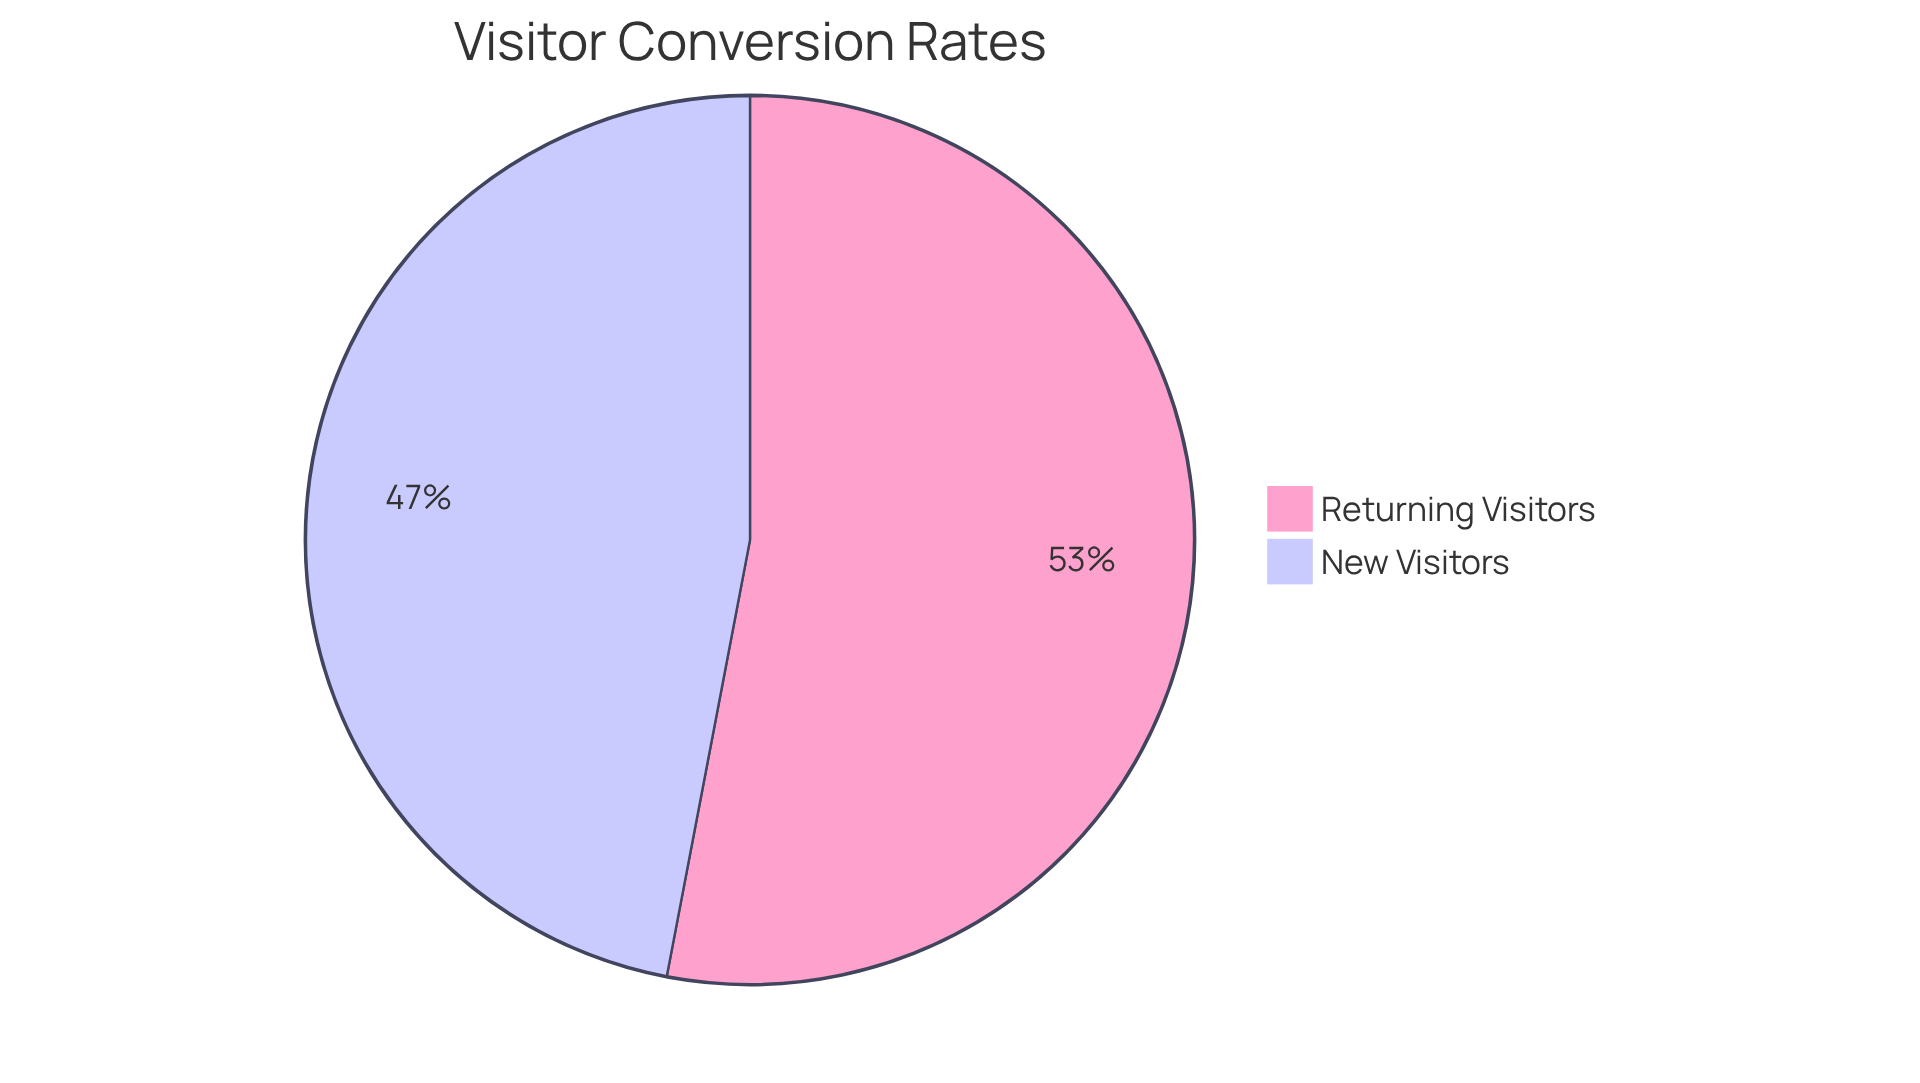
In the coming years, brands will need to rely on ux analytics tools to develop data-driven strategies that enhance customer experiences. Contentsquare's ability to recognize trends and patterns in behavior allows companies to effectively optimize their websites and applications with the help of ux analytics tools. Brands that embrace these insights often see a marked difference in their conversion rates and customer satisfaction, with returning visitors making up 53% of all visits and converting at a rate of 2.9%, compared to 1.7% for new visitors.
One retail brand used Contentsquare to map out the entire consumer journey, uncovering insights that directly boosted conversion rates. By addressing friction points - like slow page loads and unresponsive elements - brands can significantly enhance retention and satisfaction among their audience.
As digital commerce evolves, brands seeking to stay competitive will find that Contentsquare's ux analytics tools are essential. Embracing these insights can redefine how brands connect with their audience and drive real results.
Crazy Egg: A/B Testing and User Behavior Tracking for UX Refinement
Crazy Egg helps teams see how users behave on their sites, but turning that data into action isn’t always straightforward. It offers heatmaps, scroll maps, and session recordings to visualize interactions. When teams test and tweak designs based on real user data, they can create experiences that truly resonate, boosting engagement and conversions.
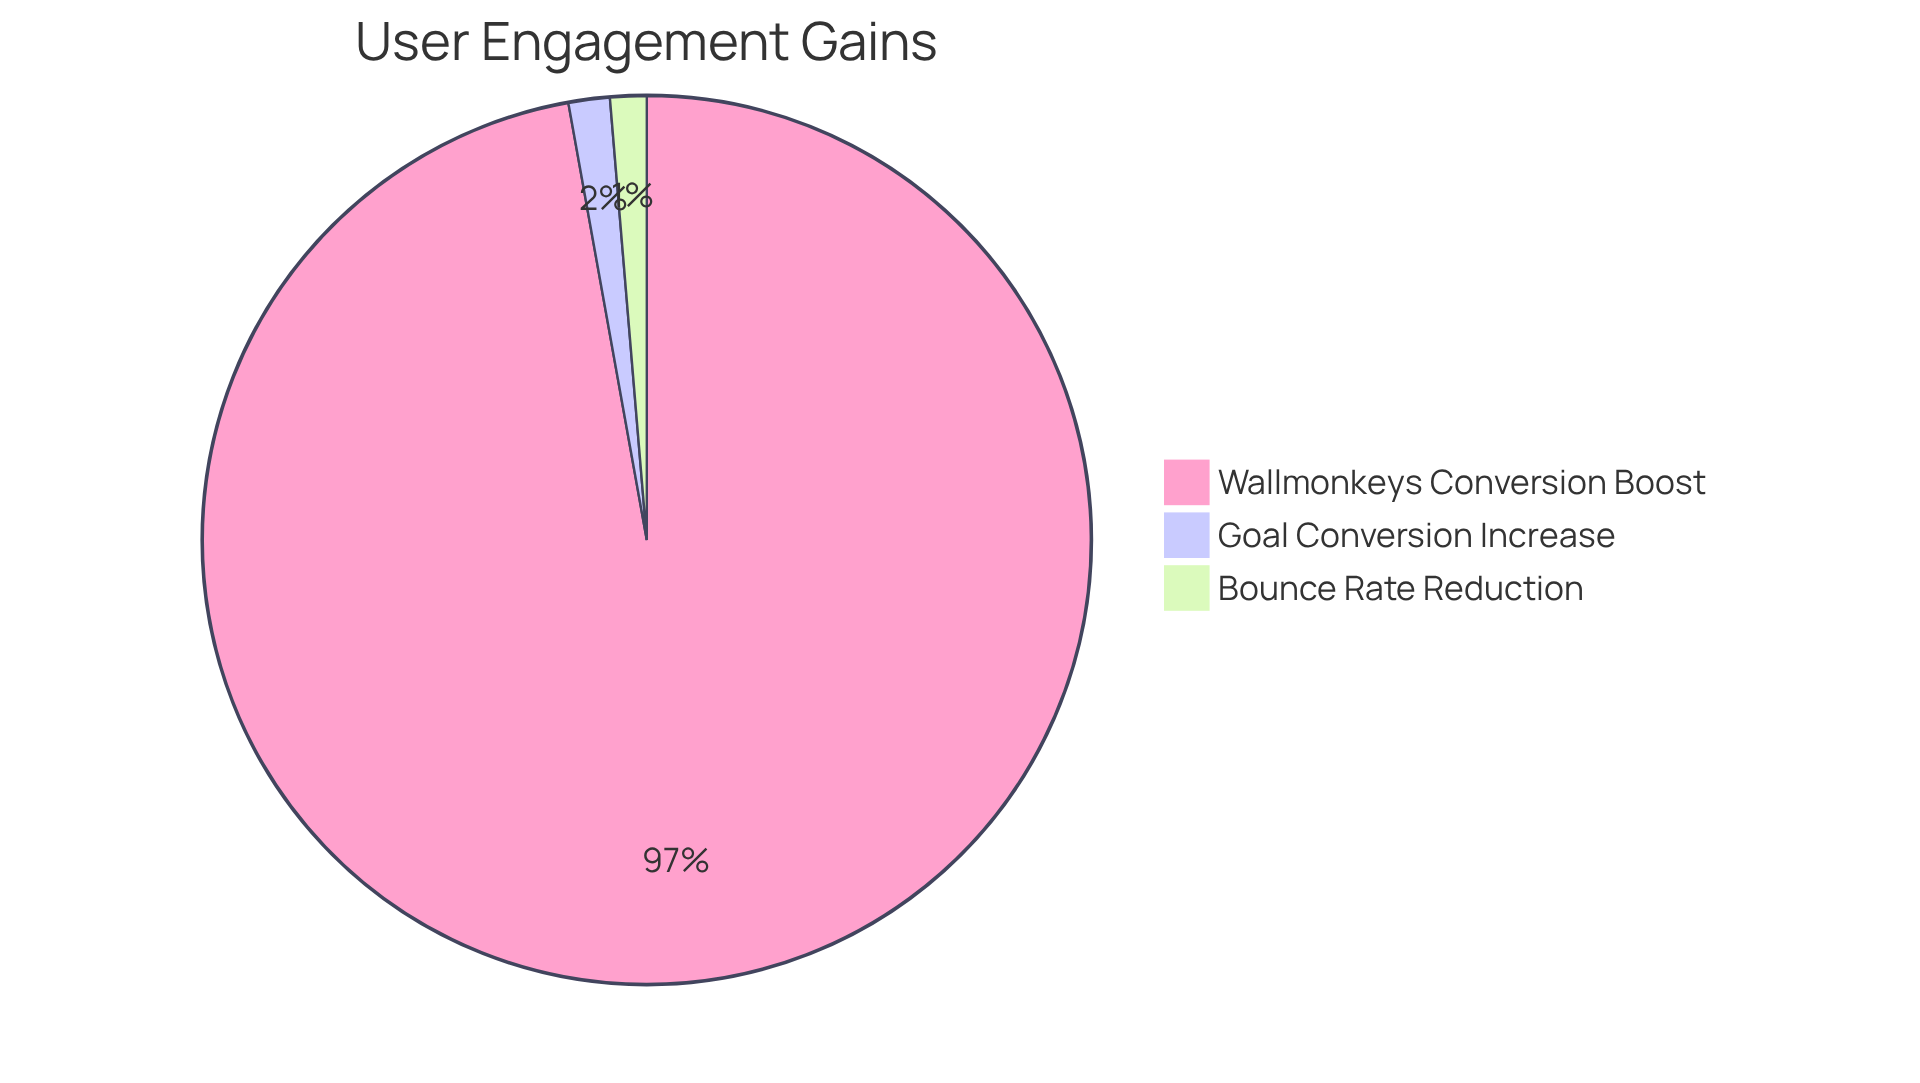
For instance, using Crazy Egg’s insights, Miller & Smith cut bounce rates by 7.5% and boosted goal conversions by 8.5%. This shows how informed design decisions can significantly impact performance.
In retail, Crazy Egg’s A/B testing capabilities have proven invaluable. Wallmonkeys adjusted their search bar based on behavior data and saw a staggering 550% increase in conversions. These numbers show how small tweaks can lead to big wins in user experience.
With over 400,000 websites using Crazy Egg, it continues to excel in user behavior tracking, equipping organizations with essential tools to improve customer journeys. Starting at $29 per month for the Starter plan, it’s accessible for various businesses. When brands harness these insights, they don’t just improve UX; they unlock potential sales and customer loyalty they didn’t know existed.
FullStory: Capturing User Sessions for Insightful UX Optimization
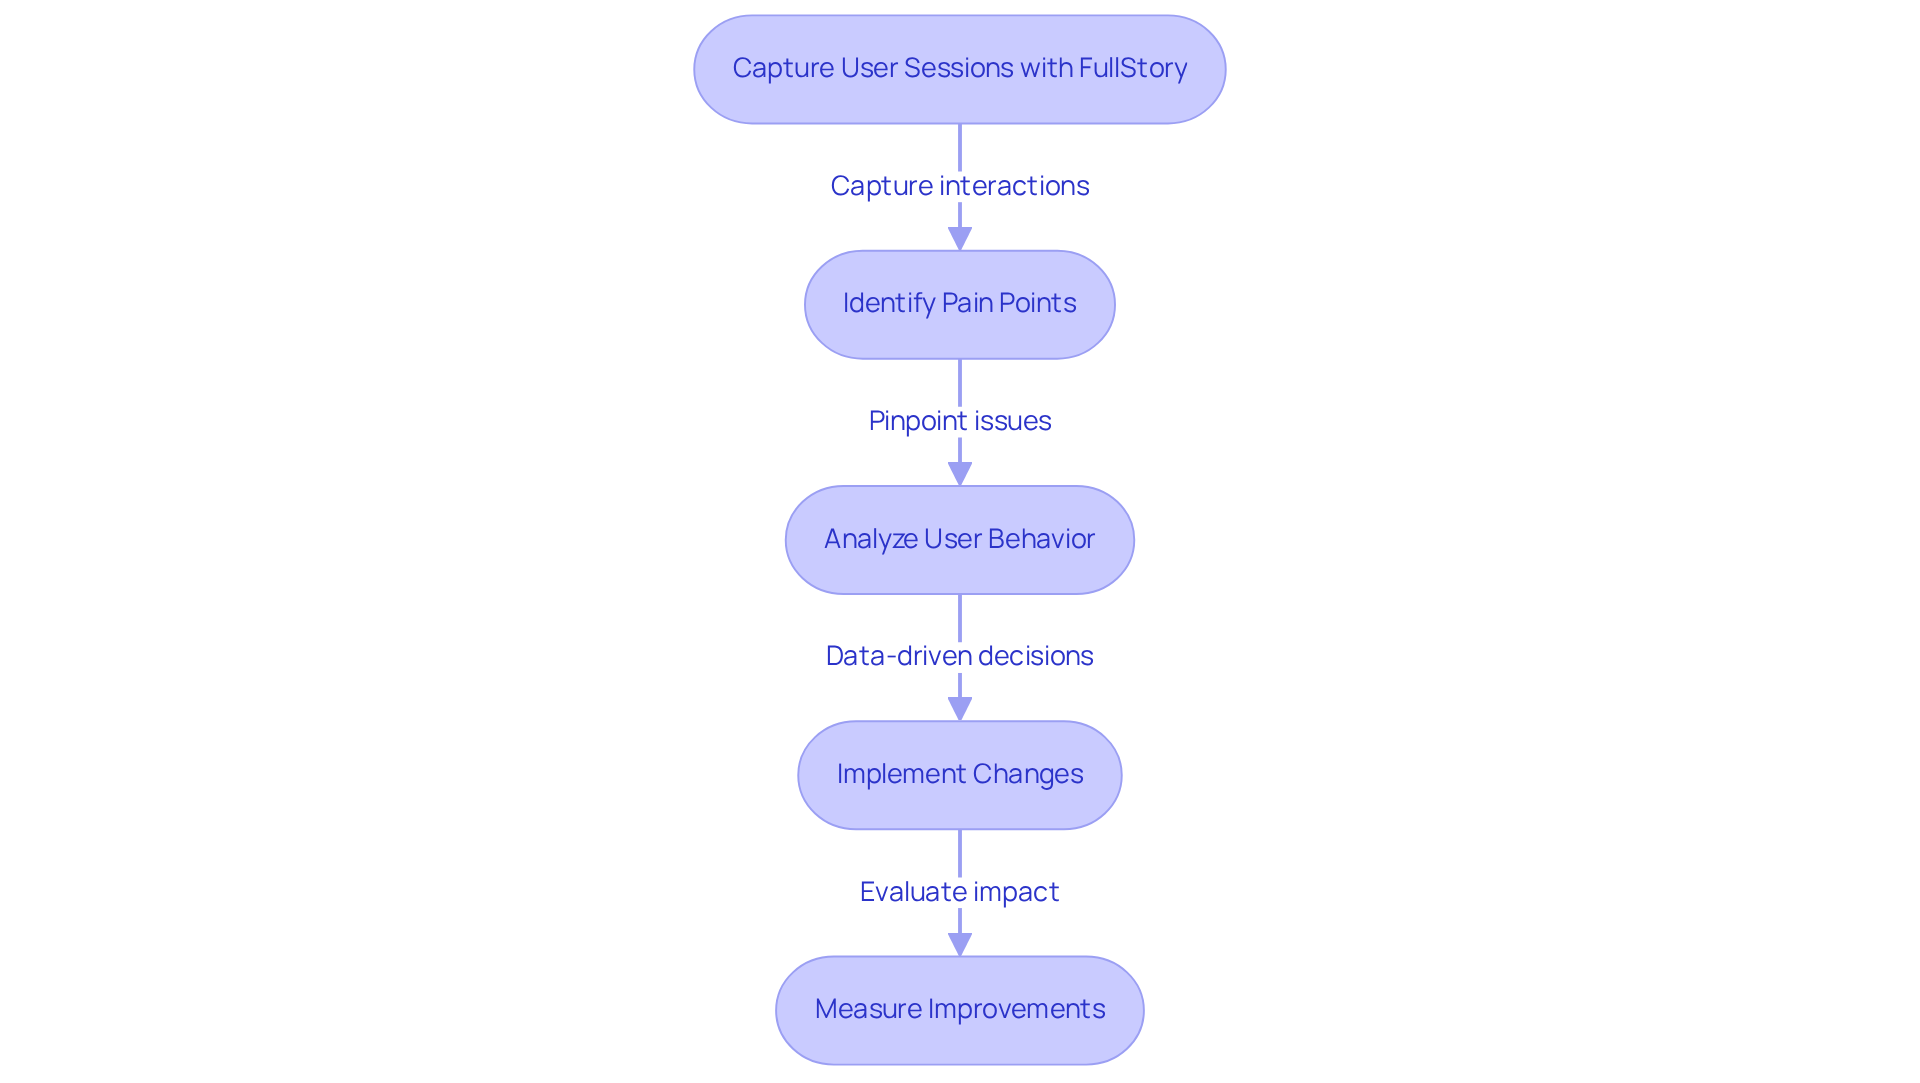
I've seen teams struggle with understanding user behavior, and that's where FullStory comes in. Its session replay feature allows teams to watch real interactions, helping them pinpoint pain points and areas for improvement. By grasping how users navigate their websites, businesses can make informed decisions that enhance overall interaction. FullStory captures every click, scroll, and interaction, making it a vital tool for optimizing user experience and boosting satisfaction.
In 2026, I noticed that nearly 70% of visitors were abandoning forms, often due to complexity and security concerns. Plus, 88% of online shoppers are less likely to return after a negative interaction. This underscores the need for UX analytics tools that can effectively identify and resolve these friction points. For instance, a case study from User Conversion showed a remarkable 26% increase in conversion rates for an e-commerce client through session replay analysis, demonstrating the real benefits of using FullStory's data.
Case studies further illustrate FullStory's impact on user experience optimization in retail. Flight Centre, for example, successfully reduced their booking fail rate by 22% after diagnosing an API-level error using FullStory's session replay and Dev Tools. These outcomes highlight the importance of understanding consumer behavior through UX analytics tools to drive meaningful improvements in digital experiences.
Moreover, implementing FullStory is quick and straightforward, allowing organizations to start capturing valuable insights without extensive setup. When organizations use FullStory to analyze session interactions, they not only improve UX but also align with their strategic goals.
Heap: Automated Event Tracking for Efficient UX Insights
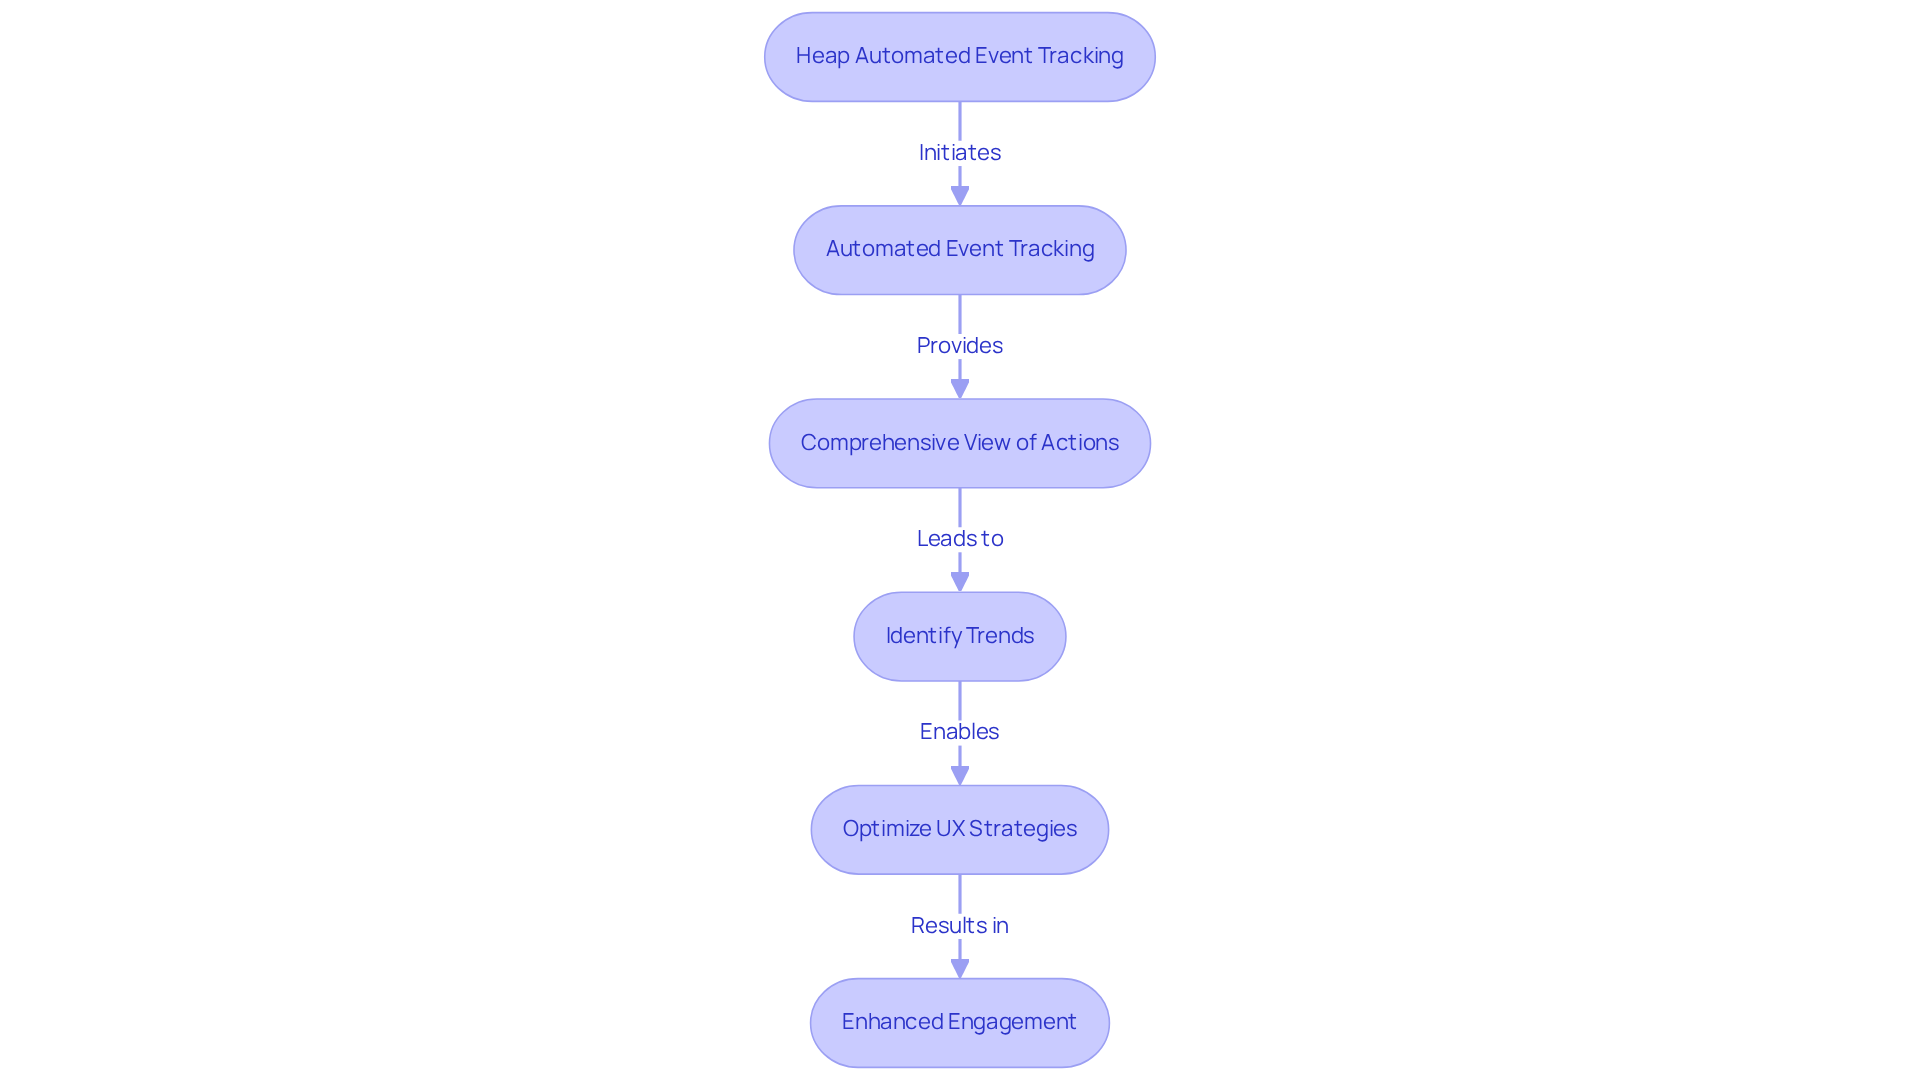
Manual tagging is a burden that hinders teams from focusing on what truly matters: analysis. Heap automates event tracking, letting teams focus on analysis instead of setup. By providing a comprehensive view of actions taken by individuals, Heap helps businesses identify trends and effectively optimize their UX strategies with UX analytics tools. Its capability to track every interaction guarantees that no valuable data is overlooked, making it essential for enhancing experiences.
Heap's recognition in the Modern Marketing Data Stack 2023 report shows its impact on marketing data. Recent case studies illustrate Heap's influence in e-commerce. For instance, the Engagement Chart feature allows teams to analyze bounce rates and page views, offering immediate action items for enhancing engagement. This feature has proven essential for organizations aiming to increase ROI and enhance conversions by identifying high-performing campaigns.
Heap's Overview Page simplifies data analysis through UX analytics tools, enabling faster decision-making and improved outcomes, which are crucial for brands navigating a competitive digital environment. The platform's automated event tracking features not only improve the experience of individuals but also reduce time to value, enabling organizations to act quickly on findings. As Rachel Obstler, CPO at Heap, emphasizes, 'By simplifying data analysis, we empower businesses to act more swiftly, enhance engagement, and boost conversions.' The platform's advanced data science tools reveal critical moments of friction and opportunity, further solidifying its role as a leader in the Modern Marketing Data Stack. By embracing Heap's insights, brands can redefine their engagement strategies and drive measurable success.
UXCam: Holistic View of User Experience through Qualitative and Quantitative Data
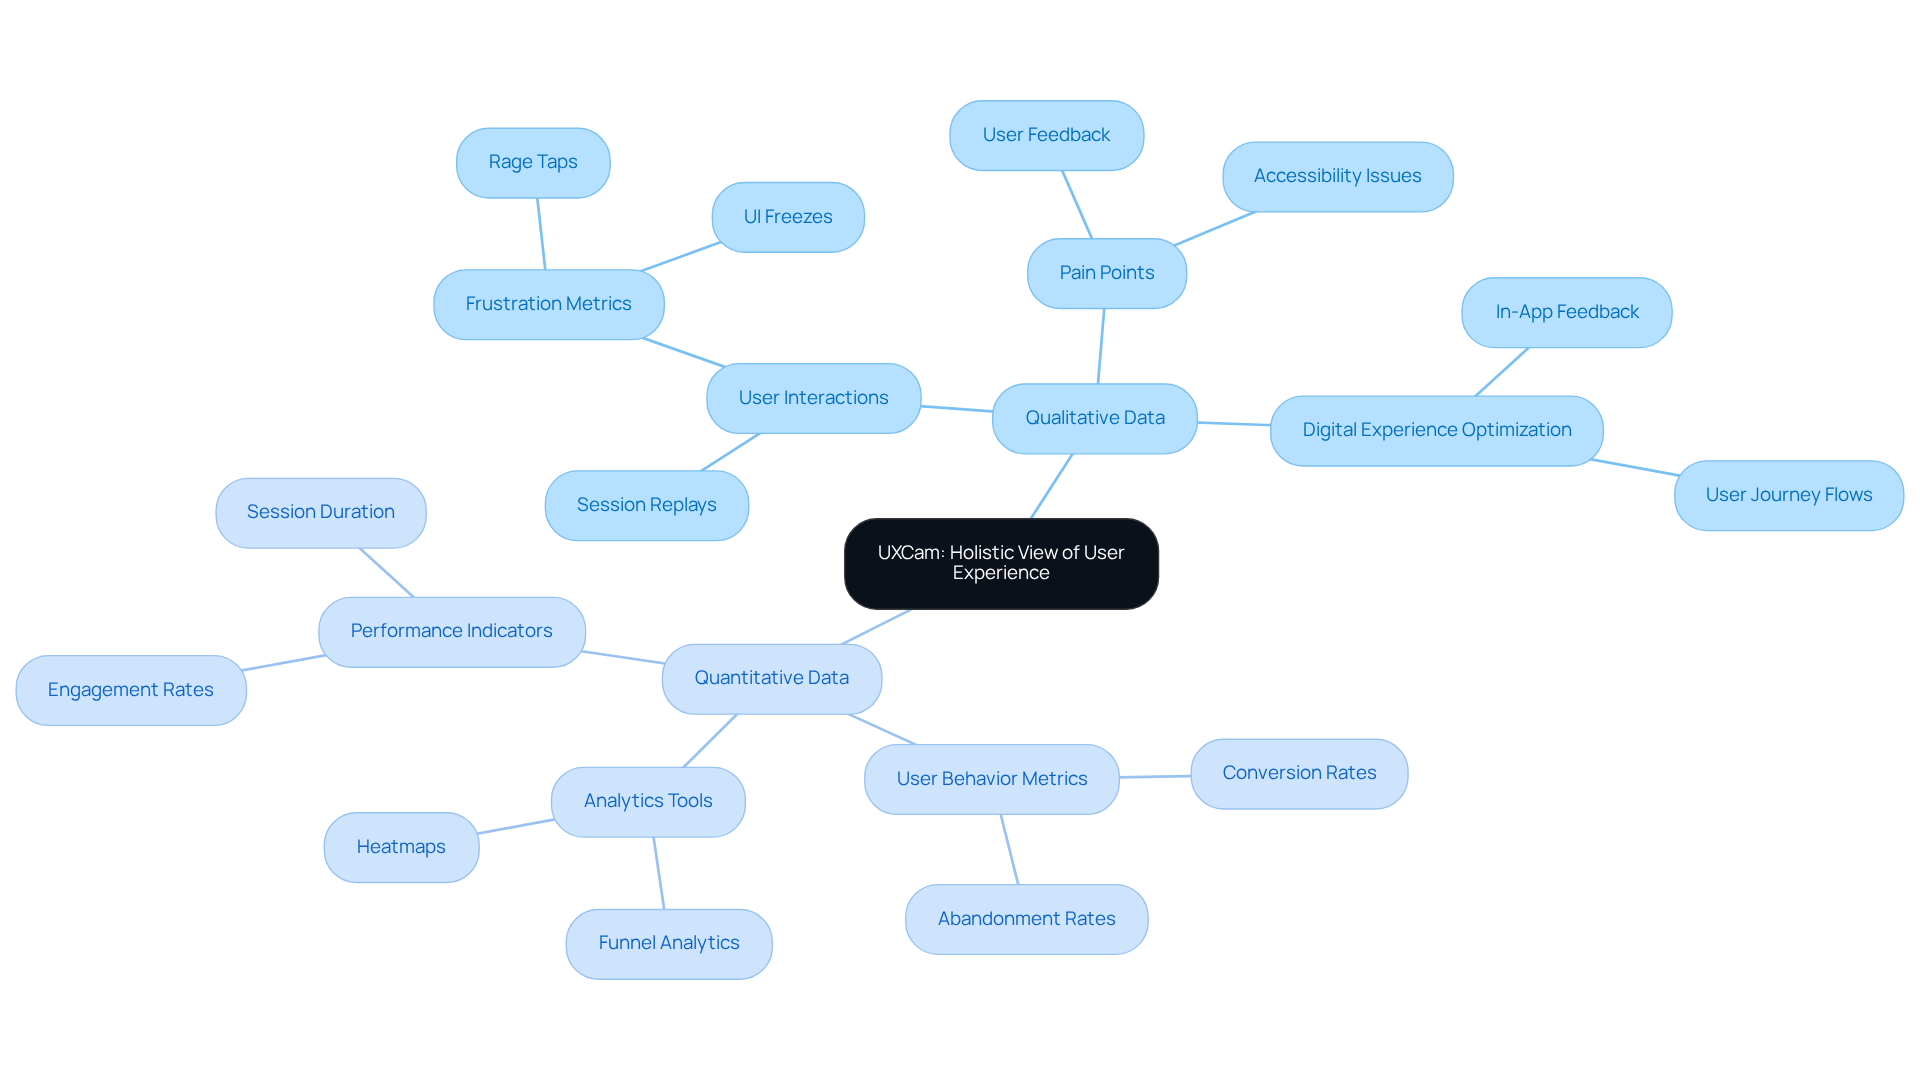
Understanding user behavior isn't straightforward; it requires more than just numbers. UXCam helps you see user interactions clearly by blending qualitative insights with quantitative data. With insights from both data types, UXCam helps teams spot pain points and fine-tune digital experiences. When you grasp both the 'what' and the 'why,' you can truly transform user experiences.
Conclusion
Many brands overlook the nuances of user experience, which can make or break their success in a crowded market. Yet many brands struggle to grasp the nuances of user experience, often missing the mark on what truly engages their audience. Tools like Google Analytics and Hotjar reveal user behavior patterns that brands can’t afford to ignore.
- Google Analytics provides comprehensive insights into user behavior,
- Hotjar visualizes interactions through heatmaps.
- Mixpanel's event-based tracking
- Amplitude's advanced product analytics further empower brands to refine their customer journeys.
These tools can help brands pinpoint what truly resonates with their audience, turning insights into action.
This shift isn't just about keeping up; it's about leading the charge in customer satisfaction and loyalty. Brands that act now to integrate these insights will not just survive but thrive in the digital age, reshaping their relationships with consumers.
Frequently Asked Questions
What services does Overskies offer to enhance user experience analytics?
Overskies provides a range of services including branding strategy, identity development, video production, photography, editing, animation, design, social media management (YouTube, TikTok, Facebook, Instagram), experiential marketing, AI-enhanced production workflows, and influencer/UGC services.
How does Overskies help brands understand consumer behavior?
Overskies integrates creative advertising solutions and UX analytics tools to help brands better understand consumer behavior, which optimizes their digital presence and enhances engagement.
What role do immersive interactions like AR and VR play in Overskies' strategy?
Immersive interactions such as AR and VR are essential for engaging audiences, and Overskies is at the forefront of helping clients craft narratives that resonate through these technologies.
Why is high-quality content important for brands according to Overskies?
High-quality content is critical because 96% of prospects research before engaging with sales, making it essential for brands to focus on strategic marketing to drive engagement and customer satisfaction.
What is the significance of Google Analytics in understanding user behavior?
Google Analytics meticulously tracks essential metrics like page views and demographics, and its event-based data model captures every action as a distinct event, providing granular insights that help optimize marketing strategies.
How can predictive metrics in Google Analytics benefit businesses?
Predictive metrics allow businesses to anticipate user behavior, such as purchase likelihood and churn risk, enabling them to leverage valuable insights that can drive success.
What insights does Hotjar provide regarding user interactions?
Hotjar uses heatmaps to show where users click, scroll, and linger, and session recordings to provide real-time insights into user navigation, helping brands make data-driven decisions.
What are some limitations of Hotjar that brands should be aware of?
Hotjar has limitations such as traffic sampling issues and the lack of mobile app support, which can complicate its use for businesses.
How does Overskies utilize AI in their analytics approach?
Overskies uses AI to sharpen insights, optimize campaigns, and boost return on ad spend (ROAS), contributing to hyper-personalized customer experiences that significantly enhance conversion rates.
What is Overskies' proprietary six-step Brand Storytelling Process?
The six-step Brand Storytelling Process is a method used by Overskies to craft compelling and memorable stories that resonate with audiences, enhancing brand engagement and loyalty.
List of Sources
- Overskies: Creative Advertising Solutions for Enhanced UX Analytics
- 2026 Marketing Statistics, Trends, & Data (https://hubspot.com/marketing-statistics)
- Brand Storytelling for 2026: Evolve, Evolve, Evolve. (https://engageadcom.com/blog/brand-storytelling-for-2026)
- Master your brand storytelling in 2026 (https://insightly.com/episodes/brand-storytelling)
- UX analytics: what it is and how to use it in 2026 (https://contentsquare.com/guides/ux-analytics)
- Google Analytics: Comprehensive Insights into User Behavior
- How to Prepare for Google Analytics Changes in 2026 (https://moduet.com/how-to-prepare-for-google-analytics-changes-in-2026)
- What's new in Google Analytics - Analytics Help (https://support.google.com/analytics/answer/9164320?hl=en)
- Web Analytics Trends 2026: Emerging Features & What To Watch (https://analytify.io/web-analytics-trends-2026)
- Google Analytics Guide for 2026: GA4 Setup, Tracking & Insights (https://seo-hacker.com/google-analytics-4-guide-2026)
- Everything You Need to Know About Google Analytics 4 (GA4) in 2026 - Tatvic Analytics (https://tatvic.com/blog/everything-you-need-to-know-about-google-analytics-4-ga4-in-2025)
- Hotjar: Visualizing User Interactions with Heatmaps and Recordings
- What is Hotjar—and how does it work? | Zapier (https://zapier.com/blog/what-is-hotjar)
- What is Hotjar? (https://statsig.com/perspectives/what-is-hotjar)
- Hotjar Review 2026: Pricing, Limits, and Verdict (https://fullsession.io/blog/hotjar-review)
- Hotjar: Visualize User Behavior on Your Website | Mut-Con posted on the topic | LinkedIn (https://linkedin.com/posts/mut-con_insightsforsuccess-activity-7432341216270163968-gMVT)
- Companies Using Hotjar in 2026: Full Customer List & Insights (https://technologychecker.io/technology/hotjar)
- Mixpanel: Event-Based Tracking for User Engagement Insights
- What is Mixpanel and how can it increase the user engagement of your website (https://leadsbridge.com/blog/what-is-mix-panel)
- The 20 digital analytics metrics that matter most | Signals & Stories (https://mixpanel.com/blog/digital-analytics-metrics)
- A data breach at analytics giant Mixpanel leaves a lot of open questions | TechCrunch (https://techcrunch.com/2025/12/02/a-data-breach-at-analytics-giant-mixpanel-leaves-a-lot-of-open-questions)
- Customer - How Tribun Network uses Mixpanel to evolve from pageviews to engagement and build Indonesia’s next media super-app | Mixpanel (https://mixpanel.com/customers/tribun-network-media-engagement-super-app-mixpanel)
- Companies Using Mixpanel in 2026: Full Customer List & Insights (https://technologychecker.io/technology/mixpanel)
- Amplitude: Optimizing User Journeys with Advanced Product Analytics
- Optimize your Amplitude workflow to improve user engagement (https://amplitude.com/docs/get-started/optimize-amplitude-workflow)
- Amplitude Introduces Agentic AI Analytics for the Next Era of Product Experiences (https://businesswire.com/news/home/20260216773220/en/Amplitude-Introduces-Agentic-AI-Analytics-for-the-Next-Era-of-Product-Experiences)
- Amplitude Introduces New Enterprise Marketing Capabilities to Boost Impact and Revenue (https://businesswire.com/news/home/20250514832140/en/Amplitude-Introduces-New-Enterprise-Marketing-Capabilities-to-Boost-Impact-and-Revenue)
- Amplitude Introduces Journeys, Industry-First Solution that Analyzes the Breadth and Depth of the Customer Journey (https://finance.yahoo.com/news/amplitude-introduces-journeys-industry-first-163000530.html)
- Amplitude Launches AI Assistant to Help Users Get Unstuck Inside Any Product Experience | Amplitude (https://investors.amplitude.com/news-releases/news-release-details/amplitude-launches-ai-assistant-help-users-get-unstuck-inside)
- Contentsquare: In-Depth Analysis of User Engagement Metrics
- Contentsquare News, Press, and Announcements (https://contentsquare.com/press)
- 15 mobile analytics stats from the 2026 benchmark report (https://contentsquare.com/guides/mobile-analytics/stats)
- Contentsquare: 97% Rethink AI Purchases Over UX (https://martechcube.com/contentsquare-97-rethink-ai-recommended-purchases-over-poor-ux)
- TOP 20 CONTENT ENGAGEMENT STATISTICS 2026 THAT REVEAL SHOCKING AUDIENCE ATTENTION SHIFTS (https://amraandelma.com/best-content-engagement-statistics)
- Brands and Retailers Look to UX for Heightened Consumer Engagement (https://wwd.com/business-news/technology/feature/brands-and-retailers-look-to-ux-consumer-engagement-10951338)
- Crazy Egg: A/B Testing and User Behavior Tracking for UX Refinement
- Using Crazy Egg to Grow Your Ecommerce Store (https://boldist.co/usability/crazyegg-ecommerce-optimization)
- UX Designers tool kit: crazy egg | Insights (https://createape.com/insight/ux-designers-tool-kit-crazy-egg)
- 7 A/B Testing Examples (Proof that Experimentation Works) (https://crazyegg.com/blog/ab-testing-examples)
- Crazy Egg vs. Hotjar: Which Tool Is Better For You? (https://crazyegg.com/blog/crazy-egg-vs-hotjar)
- Why UX Design Is the Secret Weapon of Successful eCommerce Stores - iSonic Digital (https://isonic.com.au/latest-news/why-ux-design-is-the-secret-weapon-of-successful-ecommerce-stores)
- FullStory: Capturing User Sessions for Insightful UX Optimization
- Session Replay: Uncover hidden conversion friction & grow revenue (https://noibu.com/blog/session-replay-hidden-conversion-friction)
- How to Use Session Replay for Conversion Rate Optimization (https://fullstory.com/blog/how-to-use-session-replay-for-conversion-rate-optimization)
- Doing Session Replay right (and why Fullstory is the best Session Replay software) (https://fullstory.com/blog/fullstory-operational-session-replay)
- FullStory Redefines Product Analytics Allowing Brands to Find, Validate, and Act on User Experience Data with Unmatched trust - Latest - Atlanta Tech News - Technology Headlines, Job Listings, and Events in Georgia (https://atlantatech.news/latest/fullstory-redefines-product-analytics-allowing-brands-to-find-validate-and-act-on-user-experience-data-with-unmatched-trust)
- FullStory Sees 1H Growth from Upmarket & Product Gains (https://martechcube.com/fullstory-sees-1h-growth-driven-by-upmarket-and-product-momentum)
- Heap: Automated Event Tracking for Efficient UX Insights
- Heap Announces New Features to Swiftly Reveal Valuable Product Insights (https://businesswire.com/news/home/20231116684726/en/Heap-Announces-New-Features-to-Swiftly-Reveal-Valuable-Product-Insights)
- Heap Launches Heap Illuminate to Identify New User Behavior Insights (https://solutionsreview.com/marketing-automation/heap-launches-heap-illuminate-to-identify-new-user-behavior-insights)
- Heap introduced Enhancements to Reveal Valuable Product Insights - MarTech Cube (https://martechcube.com/heap-introduced-enhancements-to-reveal-valuable-product-insights)
- Heap - Better Insights. Faster. (https://heap.io)
- 13 Best Event Tracking Tools for SaaS Companies in 2026 (https://userpilot.com/blog/event-tracking-tool)
- UXCam: Holistic View of User Experience through Qualitative and Quantitative Data
- UX Research for 2026: Top 8 Trends and Predictions (https://blog.uxtweak.com/trends-and-the-future-of-ux-research)
- What Is UX Analytics? Ultimate Guide 2026 (https://uxcam.com/blog/what-is-ux-analytics)
- 6 Best User Engagement Tools for Product Teams in 2026 (https://uxcam.com/blog/user-engagement-tools)
- 50+ UX Statistics To Convince Stakeholders 2025 (https://uxcam.com/blog/ux-statistics)
- Survicate and UXCam’s Insights in Mobile App Feedback Efficiency - ITKeyMedia (https://itkey.media/survicate-and-uxcams-insights-in-mobile-app-feedback-efficiency)
.png?width=88&name=CSI-OverskiesRebrand_LOGO-01(smaller).png)
 (201) 587-1400
 hello@overskies.com